Tuesday, April 21, 2020

COVID-19: Where are the Case-Rates Declining?

I wasn't expecting to keep doing updates to these charts, but a few things came together in the last few days and made it worth another revision. 

First, there is all the recent talk about relaxing shutdown orders.  Anyone can see from the data that this is still premature.  Very few states have any signs of a decline in the rate of new cases, while even the Trump framework calls for at least 14 days of decline.  My scan of the data shows that NY and LA are the only states with any arguable decline (apart from the more sparsely populated ones with too much statistical noise to say definitively, like VT, ID, MT, WY, AK).  The NY data could be consistent with up to a week of declining cases, but this is relatively moot since NY can't really relax its shutdown until they see declines in NJ, CT, and other neighboring states (and CT is still growing at a doubling time of some 22 days currently).  The LA data are harder to interpret, with something of a peak around the beginning of Apr.  However, that peak could also be fluctuations and the data could well be consistent with a flat rate for the past week.  Earlier on, WA was looking consistent with a decline, but the case rate went up on Apr 17 and has stayed flat there since then.  Similarly, MI was showing some hints of decline, but today's point has gone back up and made a flat-rate the most likely hypothesis.  There are no signs of declines in FL, GA, TX, VA, or MN, some of which are still going up.

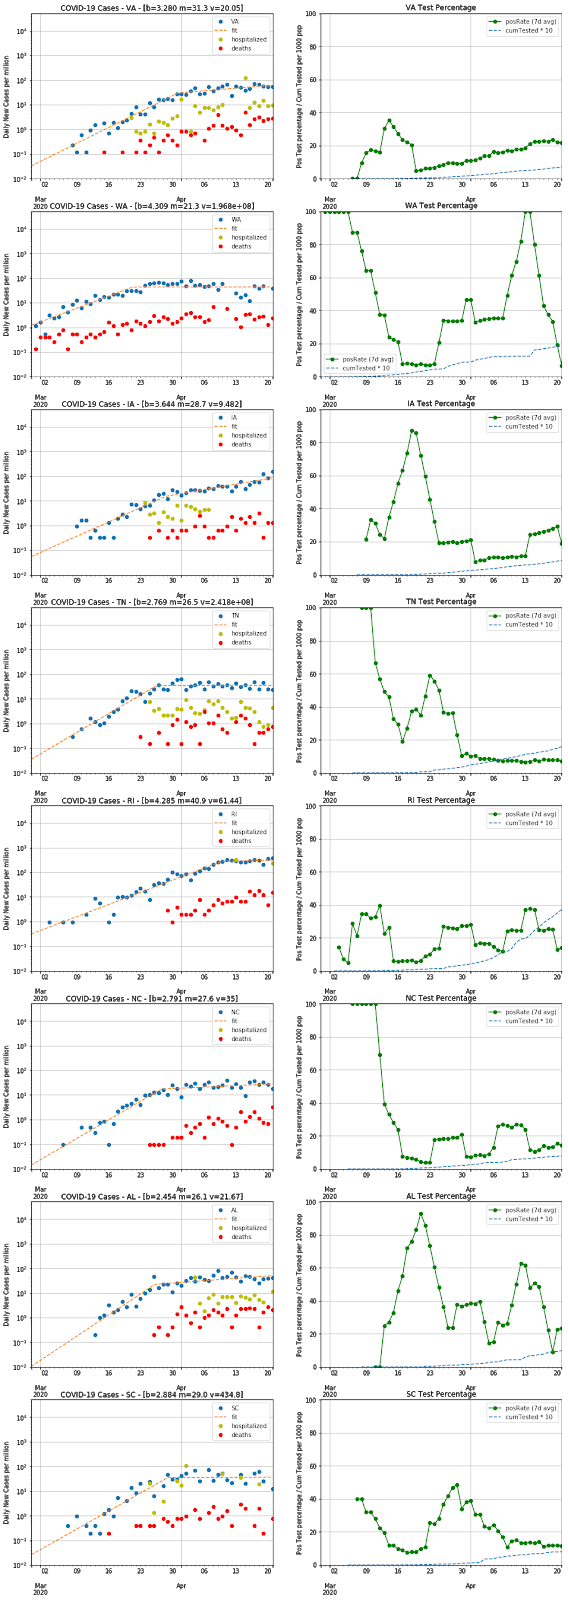
Second, I thought it was important to look at the fraction of positive test results, based on recent discussion in articles like this one in The Atlantic.  The thesis there is that the COVID-19 case rate is flattening because our testing rate has plateaued and we may be misleading ourselves and missing an ongoing exponential growth in cases.  Of course, this is why looking at the rate of COVID-19 hospitalizations or the COVID-19 deaths are going to be less biased and would avoid this type of ambiguity.  However, as I noted in the last posting, both of these are problematic (the hospitalization data are not uniformly reported and the death rates lag infection by 1-2 weeks) and therefore the case-rate is still the best metric we have.  I think, though, one can look at trends in the fraction of all tests yielding a positive result and control for the test plateau problem.  If we are limiting our tests to only the sickest patients, one should see a rise in the positive fraction over time.  Therefore, I decided to chart those for all states, along with the cumulative number of tests normalized by the state population (i.e. some approximation of the fraction of people tested).  These charts show positive rates of about 10-20% in most places, with some outliers in the 30-40% range presumably indicating constrained test capacity (like NY, NJ, CT, MA, PA, DE, MI).  There is a recent uptick in OH, which probably denotes something of interest, and MS is anomalously high and presumably means they are not reporting data to covidtracking.com in a way consistent with other states.

Third, it occurred to me that normalizing the case-rate (and the hospitalization-rate and death-rate) by state population is a good way to compare the states and calibrate how serious things are.  Hence, a NY-scale outbreak is something like 500 new cases/day per million population, while FL is running at about 50 new cases/day per million.  Along these lines, the recent outbreak in SD puts them into the 100 cases/day per million and a quiet place like AK is at 10 cases/day per million.  Overall, this is a much better way to compare the state-by-state data and loses nothing in precision on the growth rates.

As always, please send me any comments or suggestions.  All data are taken from covidtracking.com and my Jupyter notebook is here.


Thursday, April 16, 2020

COVID-19: Update on Stay-at-Home Effectiveness

Two weeks after my previous post, there are now more data available and it's pretty clear that the stay-at-home measures result in a significant flattening of the exponential growth of infections. Even areas with less-restrictive measures (like Iowa or Arkansas) show some flattening of infection growth, which presumably means that every little bit of action people take helps to reduce the transmission of this virus.

I updated my charts with the latest data from the COVID Tracking Project and added fits to a 2-piece exponential with a bend in the middle at some date.  I thought it would be interesting to see what conclusions one could draw from these fits, but it's not clear that there are any really definitive trends.  Still, I thought it worth posting in case someone else might spot some insights in these data.

Methodology

As discussed in the previous post, fitting the positive case rate is not ideal, since there could well be trends caused by changes in the testing rates or testing schemes. There is much less ambiguity in the death-rate trends, but these lag by a week or two and they often have much more statistical noise (making for harder fits). Some states are reporting hospitalization rates and those could potentially be a more solid statistic to fit, but the reporting on this is still very spotty (as you can see). Therefore, I have stuck with fitting the case-rate, while plotting the other two numbers so that one can see how well they track one another. If you see the case-rate and death-rate diverge (not simply due to the time-lag), then you have good reason to suspect changes in the testing regime.

I have used a 4-parameter piece-wise function and fit minimizing the least-squares of the difference in logs of the data and fit function. Not all of the data yielded good fits, but I haven't noted this (although you can see the problematic ones in the charts). In some cases this is due to shapes not fitting the model, like states that haven't yet flattened out or ones like PA (and perhaps IL) that may have more of a 3-legged-exponential shape. The charts below label the inflection point as "m", the doubling-time of the earlier exponential as "b", and the doubling-time of the latter exponential as "v".

Observations

From these charts, one can see that the infection slope has generally been reduced significantly in most states sometime around the latter half of March. Many states now have slopes that are nearly flat (you should consider any fit with v > 20 as flat), but some are still growing at doubling-times of 7-14 days (GA, MD, AL, KY, MS, NM). Those still growing are a mix of states with strict stay-at-home policies and ones with laxer policies, so there must be other factors at play (e.g. population density and cultural behavior). In addition, there are states that haven't yet flattened but are still growing relatively slowly (DE, SD, PR, NE, and perhaps RI).

The only states showing a decline in case-rate are WA and LA. It makes sense that WA had the earliest infections, so they might be the first to see a decline. The LA curve has an unusual shape that perhaps indicates changes in how many tests are administered, but the death-rate does seem to have flattened out so perhaps the decline is real. There are hints of a decline in NY, PA, and IN, but too few data points that don't quite make a clear trend yet. The NY data looked like a decline until today's (Apr 15) data point showed up.

At present, COVID Tracking has no data for AS (American Somoa) and very little for MP, GU, VI. In addition, the statistics on the 8 smallest states (AK, ND, MT, HI, ME, WV, VT, WY) are probably too low for good confidence in any fit parameters. It might be helpful to chart all these data normalized by state population (to see the true prevalence of infection), but that would not help the statistical challenge of these small states.

Another interesting question is whether states in warmer climates have lower infection rates, which might have an implication for whether COVID-19 will show significant seasonality. In particular, the rapid flattening in FL (despite lax shelter-in-place policies) and the relatively quick downward trend in case-rate in LA in comparison to the mid-atlantic states suggested this hypothesis. However, I think the high growth rate in MS and the slower growth rates in many colder-climate states argue against this idea.

Fits by state


State b m v State Name
AK 3.726 24.7 1.056e+08 Alaska
AL 2.578 25.0 12.56 Alabama
AR 2.708 20.4 15.9 Arkansas
AS 0.000 0.0 0 American Somoa
AZ 2.674 26.0 61.4 Arizona
CA 3.428 28.0 69.16 California
CO 3.071 26.0 1623 Colorado
CT 2.089 26.8 19.17 Connecticut
DC 3.994 31.7 69.85 District of Columbia
DE 3.711 26.0 6.014 Delaware
FL 2.484 27.0 70.47 Florida
GA 2.485 23.9 13.74 Georgia
GU 11.780 24.0 89.11 Guam
HI 3.913 24.3 2.513e+07 Hawaii
IA 3.651 29.0 14.16 Iowa
ID 2.972 28.5 1.537e+08 Idaho
IL 1.879 21.5 10.04 Illinois
IN 2.486 29.2 2.502e+07 Indiana
KS 3.397 29.3 3.515e+05 Kansas
KY 3.660 28.0 10.54 Kentucky
LA 2.129 25.0 276.3 Louisiana
MA 3.066 28.5 15.03 Massachusetts
MD 2.870 28.0 10.25 Maryland
ME 2.963 20.3 26.41 Maine
MI 2.486 15.4 23.57 Michigan
MN 2.767 21.3 21.61 Minnesota
MO 1.951 26.6 191.5 Missouri
MP 0.000 0.0 0 Northern Mariana Islands
MS 1.672 20.9 13.66 Mississippi
MT 3.954 26.0 123.9 Montana
NC 2.791 26.6 44.33 North Carolina
ND 2.923 19.6 15.91 North Dakota
NE 9.018 15.0 5.8 Nebraska
NH 4.239 31.0 942.3 New Hampshire
NJ 1.881 25.5 43.08 New Jersey
NM 4.514 29.9 12.6 New Mexico
NV 3.081 27.5 2.2e+07 Nevada
NY 1.963 22.6 34.56 New York
OH 2.240 24.8 29.2 Ohio
OK 2.615 27.6 80.67 Oklahoma
OR 4.097 26.0 528.7 Oregon
PA 2.403 28.7 26.71 Pennsylvania
PR 9.094 72.2 10.13 Puerto Rico
RI 4.086 30.0 5.703 Rhode Island
SC 2.875 28.2 5.332e+07 South Carolina
SD 23.811 16.0 4.543 South Dakota
TN 2.769 25.7 1032 Tennessee
TX 2.831 31.2 65.69 Texas
UT 2.454 23.4 87.3 Utah
VA 3.280 30.3 20.3 Virginia
VI 2.627 20.0 4761 Virgin Islands
VT 3.090 24.0 2470 Vermont
WA 4.443 21.3 1.646e+08 Washington
WI 1.654 18.7 21.41 Wisconsin
WV 2.180 27.1 36.02 West Virginia
WY 5.308 31.0 110.3 Wyoming


Notes

As before, my Jupyter notebook file for this analysis is available for anyone who might be interested. Please send me comments and suggestions that occur to you.